
Geoids and quasigeoids
Geoids represent the hypothetical global mean sea level as it would be shaped by gravity if oceans could flow unobstructed though land. It acts as an equipotential gravity surface, undulating across the planet due to uneven mass distribution from factors like mountains, oceans and geology.
Quasigeoid (‘almost geoids’) are a more pragmatic solution to deriving the equipotential gravity surface, using approximations for some of the more complex parameters. While this reduces accuracy, it is sufficient for most practical applications. Quasigeoids serve as a consistent reference surface for measuring elevations and are a component of many vertical datums.
The official geoid for New Zealand is New Zealand Quasigeoid 2016 (NZGeoid2016). This is the reference surface for New Zealand Vertical Datum 2016 (NZVD2016).
New Zealand Vertical Datum 2016
Note that this website and many other references use the terms geoid and quasigeoid interchangeably.
Gravity
Gravity pulls objects towards the centre of the Earth, giving objects weight and causing water to flow downhill. Gravity can be measured using a gravimeter, which either measures the acceleration of a test mass when it is dropped within the instrument, or very accurately measuring an object’s weight.
Geodesy is the study of the size, shape and rotation of the Earth and its gravity field. Large gravity datasets were required to produce New Zealand Quasigeoid 2016 (NZGeoid2016), gravity data was collected on land and at sea, and from both aircraft and satellites.
The image below shows this data combined to produce a Bouguer gravity field map for New Zealand. The Bouguer gravity field shows variations between global gravity models and the data observed in a local area, which allows us to identify anomalies in geology. This can include the location of elements, minerals, tectonic features, faults and mountain ranges. The data can also be used to investigate the structure of the Earth's crust and mantle (including the movement of magma beneath volcanoes).

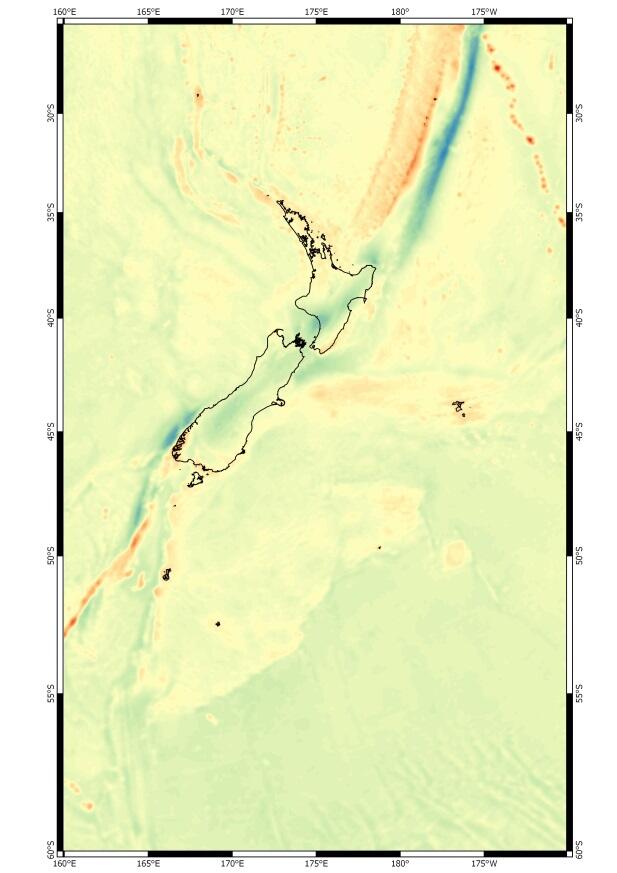
Bouguer gravity field map for New Zealand
In the Bouguer gravity field map of New Zealand, we can identify:
- a gravity low (shown in blue) across the Southern Alps where the root of this mountain range is subducting
- a gravity low (shown in blue) in the Whanganui Basin due to the run-off of material from the Central Plateau
- a gravity high (shown in red) around the Subantarctic Islands and Kermadec Islands due to rifting and seamounts
- a gravity high (shown in red) at the Chatham Islands due to a build-up of continental plate material.
Various gravity datasets collected and produced by the NZGeoid2016 project are available for download on the LINZ Data Service: