Visit the QGIS Project website for more help and to download the application.
Accessing LDS web services
The first step in accessing LDS web services is to create a web services key or API key. These are short codes (such as abcdefgh123456789) unique to each LDS user, and simplify the process of accessing web services.
LINZ Data Importer QGIS plugin
Get the LINZ Data Importer QGIS plugin for access to all WMTS supported data from the LINZ Data Service in QGIS.
Important notes
- QGIS supports the ‘Identify Features’ (Get FeatureInfo) function for WMTS.
- Offshore Islands that are east of the anti-meridian line are displayed to the far left of the New Zealand mainland in QGIS. This is because the 180 degree anti-meridian acts as the right-most boundary of the map.
How to use LDS WMTS in QGIS
- You can alter the transparency of the tiled dataset by right-clicking on the dataset and selecting Properties > Transparency. This can improve visualisation of data overlays.
- Ensure the Render box in the bottom-right corner is checked.
- If you want to switch between the Web Mercator and NZTM tile set versions you will need to make a new connection to a dataset. Switching between tile sets cannot be done on the fly within an existing connection.
The following process for accessing LDS Web Map Tile Service in QGIS is performed using QGIS version 3.4.11.
Step 1
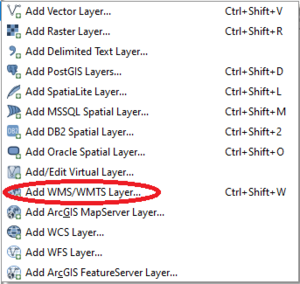
From the QGIS application, go to Layer > Add Layer and click the Add WMS/WMTS Layer (globe icon) to bring up the Add layer window:
Step 2
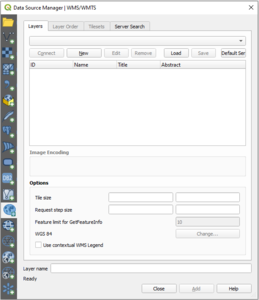
Click New:
Step 3
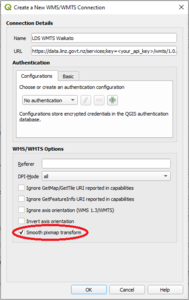
Enter a name in the Name field, such as 'LDS WMTS Waikato'.
Copy and paste the WMTS URL from the ‘Services’ tab of your dataset in LDS into the URL field. Most raster datasets on LDS can be accessed via WMTS. For example, see the Services tab for the Waikato 0.3m Rural Aerial Photos.
Tick the Smooth pixmap transform checkbox. This option smooths and optimises the rendering of images. Click OK.
There's no need to enter a username and password – your API key tells the LINZ Data Service you are a registered user.
Step 4
This connection will be added to the Layer dropdown box. Click Connect to fetch your WMTS tiled dataset.
If you need to enter any proxy access credentials, QGIS may prompt you. Otherwise see step 6 to enter your proxy settings.
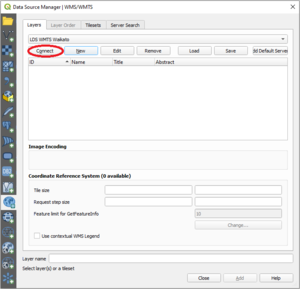
Step 5
Your WMTS dataset will appear in the Tilesets tab:
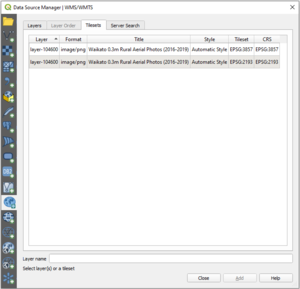
Step 6
If your request fails, you may need to change your internet settings to use a proxy server and enter your proxy details. To change these settings in QGIS:
Select Settings > Options > Network, then tick the Use proxy for web access box, and fill out the details according to your IT policy.
A typical configuration that is required in a Windows Corporate environment is the use of the Windows default 'Internet Settings'. To do this you only need to set the proxy type to 'DefaultProxy'.
For Windows users this will re-use your Internet Setting which is set through Internet Explorer or Edge.
Make sure all other settings (host, port, user, password and exclude URLs) are all cleared.
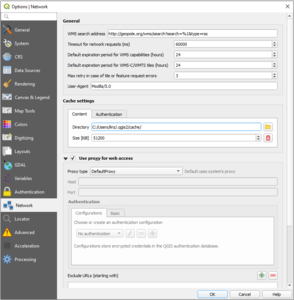
Step 7
At this point, you can choose the tileset for the dataset you wish to connect to – in this case, either Web Mercator (EPSG:3857) or NZTM (EPSG:2193). Click on the dataset to highlight it, then click Add. Close the window.
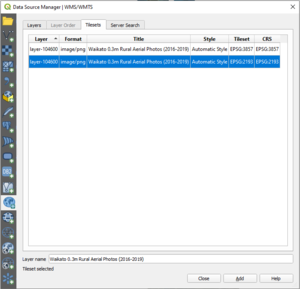
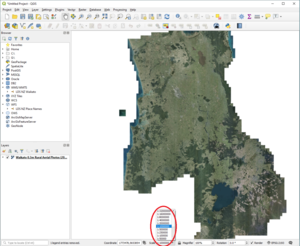
In this example, the NZTM tileset of the Waikato 0.3m Rural Aerial Photos layer has been added:
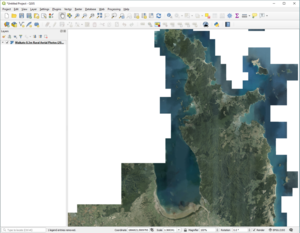
Step 8
You can add multiple tiled datasets to the same project if your work spans a wider area. Follow the process above to make another WMTS connection, adding the datasets in the same tileset projection.
To turn these datasets on and off, use the check box under the Layer panel.
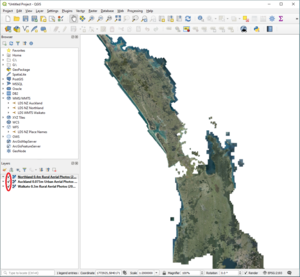
Step 9
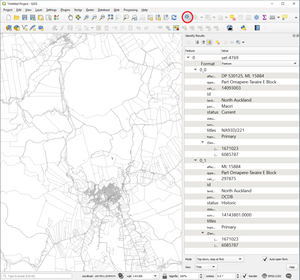
If you have connected to a NZ Parcel Boundaries WMTS, you can use the ‘Identify’ (Get FeatureInfo) function in QGIS to view related attribute data for a parcel.
Click on the ‘Identify Features’ icon in the toolbar, then select a parcel. You can view the feature information in either html or feature format.
Step 10
To get the best quality result from our NZTM tile services, you may want to load the tileset scales file into your application. This will let you zoom in and out according to the preset zoom levels.
Note that if you’ve loaded the tileset file the only way to preserve these pre-set scales when zooming is to select the level from the Scale box. Use of the zoom in and out tools in QGIS, or the wheel on your mouse, will not preserve the defined zoom levels.
File downloads for both NZTM and Web Mercator:
To load the file:
- Go the Project menu and select Project Properties…
- Under the General tab, check the Project scales box
- Select the Load icon
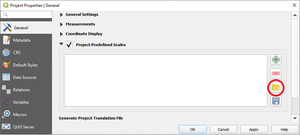
- Browse to the scale set file in its saved location, then Open the file
- Click OK.
To ensure the proper use of the zoom scale, you must select an initial zoom level from the Scale box on the bottom right of the screen. It does not matter which zoom level you select.
