New Zealand has 13 official local vertical datums (LVDs), which were established by determining mean sea level (MSL) and then transferring this throughout a benchmark network. In contrast, New Zealand’s national height datum is now New Zealand Vertical Datum 2016 (NZVD2016), which is referenced to the reference surface New Zealand Quasigeoid 2016 (NZGeoid2016).
New Zealand Vertical Datum 2016
Heights can be converted between an LVD and NZVD2016 by applying an offset correction (https://www.linz.govt.nz/guidance/geodetic-system/understanding-coordinate-conversions/converting-between-nzvd2016-nzgd2000-and-local-vertical-datums). The value of the offset depends on horizontal position, so a relationship grid is needed.
Converting between NZVD2016, NZGD2000 and local vertical datums
The vertical datum relationship grids are on a 2’ x 2’ arc (approximately 3.6km x 3.6km) grid across the area covered by the datum.
Find out how the grids were computed
The vertical datum relationship grids are described in the table below.
| Local vertical datum | Relationship grid extents |
|---|---|
| One Tree Point 1964 | 34.3°S – 36.8°S, 172.6°E – 175.0°E |
| Auckland 1946 | 36.1°S – 38.0°S, 174.0°E – 176.2°E |
| Moturiki 1953 | 36.5°S – 40.7°S, 174.5°E – 178.3°E |
| Gisborne 1926 | 37.4°S – 39.0°S, 177.0°E – 178.6°E |
| Napier 1962 | 38.6°S – 40.6°S, 175.6°E – 177.9°E |
| Taranaki 1970 | 38.3°S – 41.1°S, 173.6°E – 176.4°E |
| Wellington 1953 | 39.1°S - 41.6°S, 174.4°E – 176.4°E |
| Nelson 1955 | 40.4°S – 42.7°S, 171.3°E – 174.4°E |
| Lyttelton 1937 | 41.3°S – 45.1°S, 168.5°E – 174.2°E |
| Dunedin 1958 | 43.9°S – 46.5°S, 168.4°E – 171.3°E |
| Dunedin-Bluff 1960 | 45.0°S – 46.7°S, 167.4°E – 169.9°E |
| Bluff 1955 | 46.3°S – 46.8°S, 168.2°E – 169.9°E |
| Stewart Island 1977 | 46.5°S – 47.5°S, 167.2°E – 168.8°E |
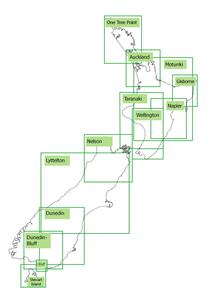
The location and extent of each LVD is shown in the image below.

Map of New Zealand showing the extents for the locations detailed in the Regions column in the table